One of the cool things about being on Twitter is the rapid rate at which you discover new resources on the web. Just a few minutes ago, I saw “6 Unique Twitter Visualizations” http://bit.ly/Fz05O from @RSS_Buzztracker. The first thing you do, of course, is to make it a favorite and retweet it so that your friends can enjoy it too.
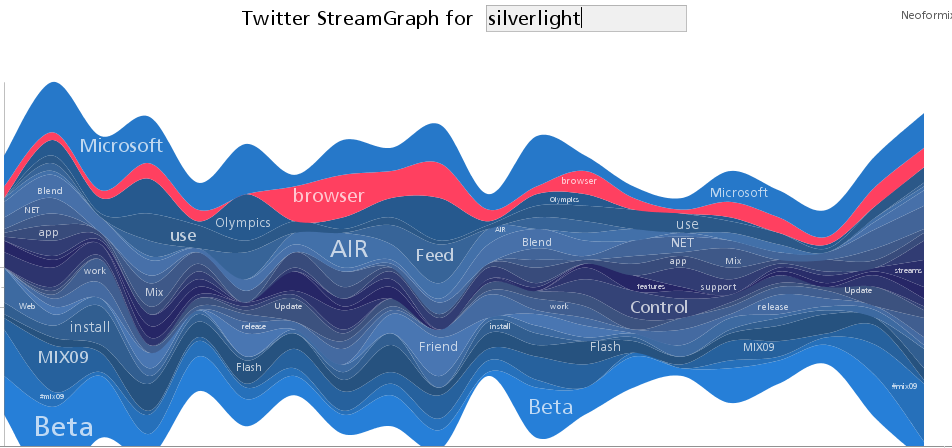
The next thing is to go and investigate. Two of them just blew me away. I managed to grab and reproduce one of them here. It is called Twitter StreamGraph. You simply type the word or phrase and it provides a nice visualization. Since I was watching MIX09 videos yesterday (from Chennai, India) and knew that there is a lot of buzz going on around Silverlight 3.0, I decided to try it out. Here is what I got. It may be different when you try it:

The next one, called Twitter Thoughts is a fabulous motion chart. I have been fascinated by the power of motion charts ever since I saw one in a TED Talk a couple of years ago. Here is how it works:
TwitterThoughts creates charts based on Twitter tweets in combination with lots of APIs: From a sample of 600 tweets/minute served by the Twitter Api that we send to Yahoo Pipes where it extracts all phrases from the tweet text and the latitude/longitude with use of Yahoo YQL. This Yahoo Pipe outputs serialized PHP back to our local update script that grabs every tweet and phrase and puts it in our MySql database. Daily overviews for fast rendering of the chart data are generated with a daily CRON update. Finally Google Visualization API generates an interactive flash chart based on our JSON data feed.
I think as we get more useful data, especially trending data, we will start finding more innovative visualizations.