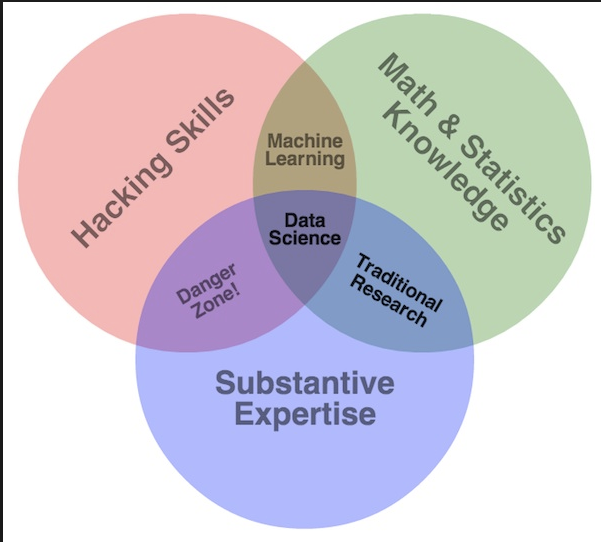
How to read the Data Science Venn Diagram
The primary colors of data: hacking skills, math and stats knowledge, and substantive expertise
via dataists.com
Technopreneur
Technopreneur
How to read the Data Science Venn Diagram
The primary colors of data: hacking skills, math and stats knowledge, and substantive expertise
One thought on “LinkLog: The Data Science Venn Diagram”
Currently in the red zone – need more math and statistics for me.
Comments are closed.